Inventory
651-770-5000
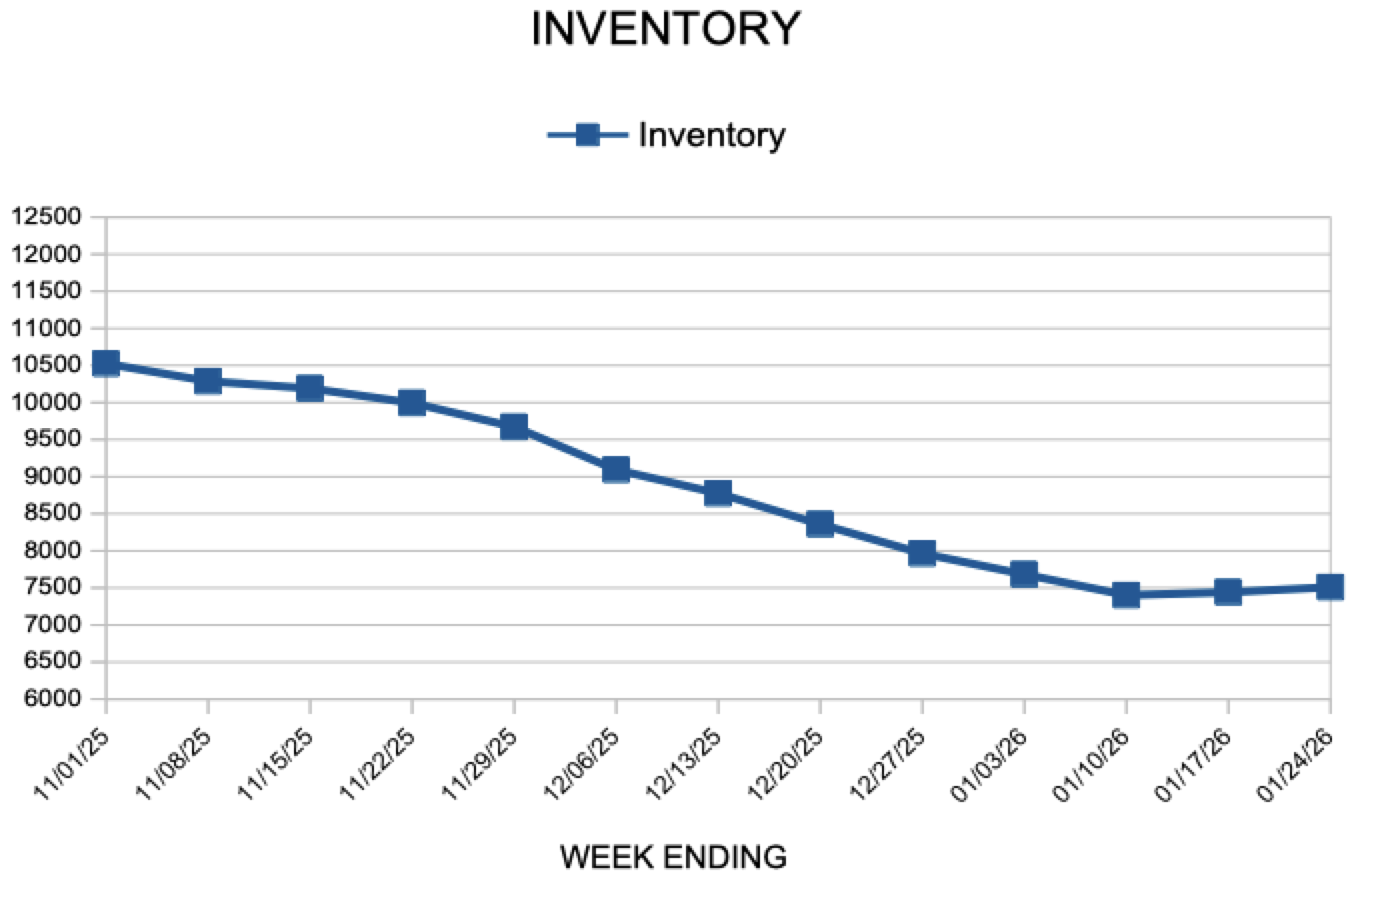
 For Week Ending January 24, 2026
U.S. new-home sales rose 18.7% year-over-year in October, reaching a seasonally adjusted annual rate of 737,000 units, according to long-awaited data from the U.S.Census Bureau. On a monthly basis, sales were essentially flat, dipping just 0.1% from September’s 738,000 units. The median new-home sales price fell 3.3% month-over-month to $392,300, down 8% from October 2024.
IN THE TWIN CITIES REGION, FOR THE WEEK ENDING JANUARY 24:
FOR THE MONTH OF DECEMBER:
All comparisons are to 2025
Click here for the full Weekly Market Activity Report. From MAAR Market Data News.
January 29, 2026
Mortgage rates remain near their lowest levels in three years, which is encouraging for potential homebuyers who have waited to enter the market for some time. Lower rates, combined with strong income growth, have led to a steady increase in purchase applications compared to last year. More homeowners refinancing their mortgages are also benefiting from these lower rates, as shown by the rise in refinance applications over the past year.
Information provided by Freddie Mac.