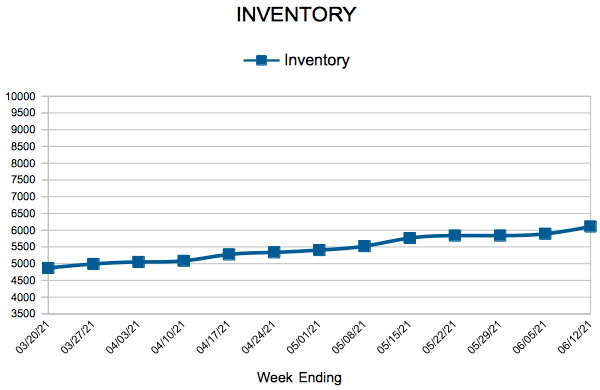
Inventory
651-770-5000
 For Week Ending June 12, 2021
U.S. median rental prices increased 5.5% year over year for an average of $1,527 in May, exceeding pre-pandemic figures and putting rents at their highest level in two years, according to realtor.com’s Monthly Rental Report. Meanwhile, after months of record highs, lumber prices have finally begun falling, with futures for July delivery down 41% since May’s record high, their biggest ever weekly loss, Bloomberg reports. Still, demand for housing remains strong as ever, with mortgage and refinance applications up from the previous week, according to the Mortgage Bankers Association.
In the Twin Cities region, for the week ending June 12:
For the month of April:
All comparisons are to 2020
Click here for the full Weekly Market Activity Report. From MAAR Market Data News.
Home prices are still on the increase and that is not likely to change during the summer months. The Median Sales Price increased 16.1 percent to $342,500 for the month.
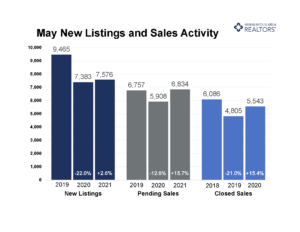
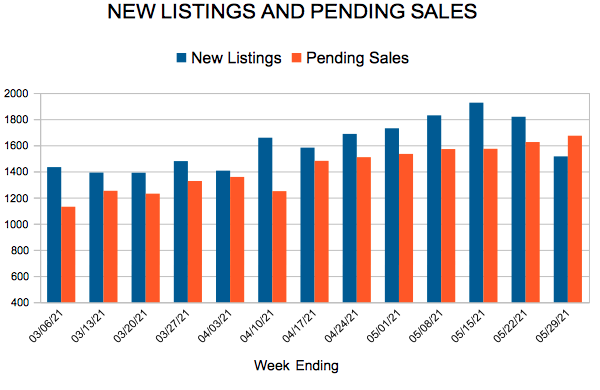
(June 16, 2021) – According to new data from the Minneapolis Area REALTORS® and the Saint Paul Area Association of REALTORS®, buyer activity in May was up 15.7 percent compared to last year, a twelfth-straight increase in month-over-month pending sales. Demand from buyers in the Twin Cities metro continues to out-pace the supply of new listings into the market.
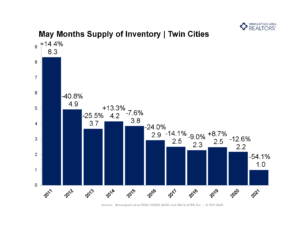
Seller activity in May grew slightly in a year, up 2.6 percent from 2020, but dropped by 19.9 percent compared to 2019, our most recent pre-COVID year. The relative imbalance in performance between buyers and sellers has led to a strong seller’s market. Currently, the Twin Cities has 1.0 month’s supply of inventory. Typically, four to six months is considered a balanced market.
“Half of all listings in the Twin Cities have an accepted offer within a week,” according to Tracy Baglio, President of the Saint Paul Area Association of REALTORS®. “As the summer season begins to build, buyers need to continue to be prepared to make firm decisions and strong offers on a home.”
In May, homes spent a median seven days on market, which is down 56.3 percent from last year. The quick shelf life of listings is particularly impressive given that the median price of a home in the Twin Cities metro rose to $342,500, a 16.1 percent increase from last May. The 30-Year Fixed Rate Mortgage Average in the United States did not exceed 3.0 percent, giving buyers the ability to stretch their dollar further.
“Recent showing activity shows that prospective home buyers shifted their interests to more expensive homes,” said Todd Walker, President of Minneapolis Area REALTORS®. “Two years ago, listings priced under $200,000 saw the largest share of showing activity. This year listings around $250,000 have seen the greatest share of activity.”
Activity varies by area, price point and property type. Sales of single-family homes were up 42.1 percent in Minneapolis and 16.7 percent in St. Paul, suggesting demand remains strong in the core cities. Condos continue to lead sales growth by property type. Across the 16-county Twin Cities region condo sales rose 98.3 percent. Sales of previously owned homes rose 18.3 percent while new construction rose 5.5 percent.
May 2021 by the numbers compared to a year ago

 For Week Ending June 5, 2021
Fannie Mae’s new refinancing program, RefiNow™, which offers qualifying homeowners with a Fannie Mae-owned mortgage new options for refinancing their loans, officially starts on June 5th. Borrowers at or below 80% of the area’s median income may qualify for this new program, which can lower interest rates and reduce monthly payments by $50 or more. Homeowners can learn more about qualifications and their options by contacting their lender or visiting KnowYourOptions.com.
In the Twin Cities region, for the week ending June 5:
For the month of April:
All comparisons are to 2020
Click here for the full Weekly Market Activity Report. From MAAR Market Data News.
 For Week Ending May 29, 2021
According to Black Knight, mortgage loan delinquency rates are continuing to decline, with the national delinquency rate falling to 4.66% in its April survey from 5.02% in March. While the continued decline of delinquency rates is a positive sign, nearly 1.8 million first-lien mortgages remain seriously delinquent, which is 1.3 million more than before the pandemic.
In the Twin Cities region, for the week ending May 29:
For the month of April:
All comparisons are to 2020
Click here for the full Weekly Market Activity Report. From MAAR Market Data News.