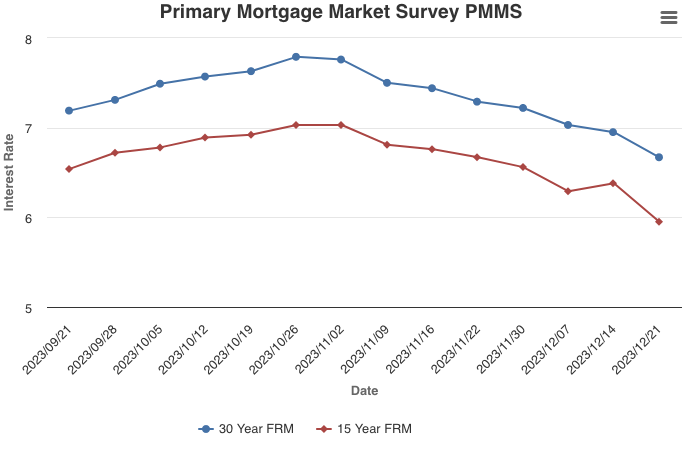
December 21, 2023
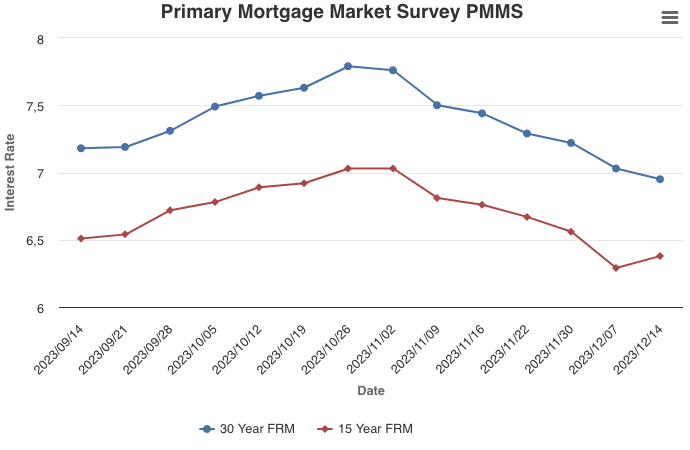
The 30-year fixed-rate mortgage remained below seven percent for the second week in a row, a welcome downward trend after 17 consecutive weeks above seven percent. Lower rates are bringing potential homebuyers who were previously waiting on the sidelines back into the market and builders already are starting to feel the positive effects. A rise in homebuilder confidence, followed by new home construction reaching its highest level since May, signals a response to meet heightened demand as current inventory remains low.
Information provided by Freddie Mac.
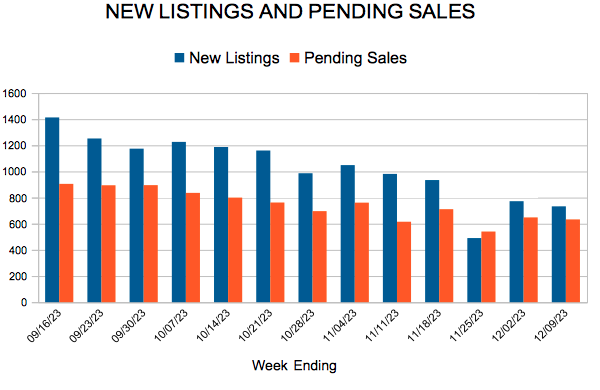
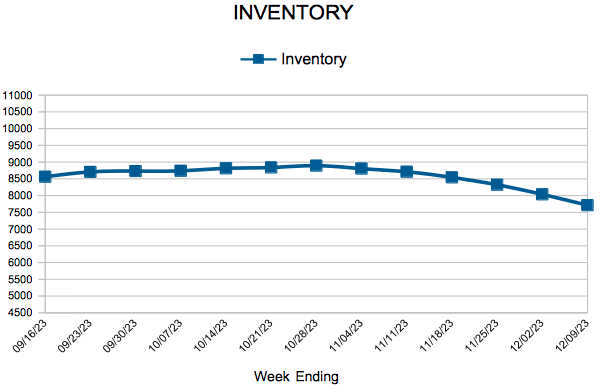
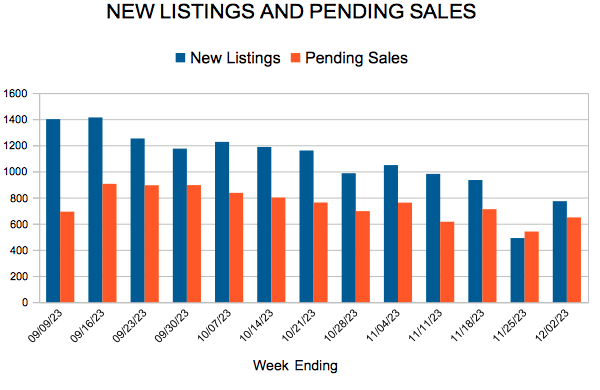
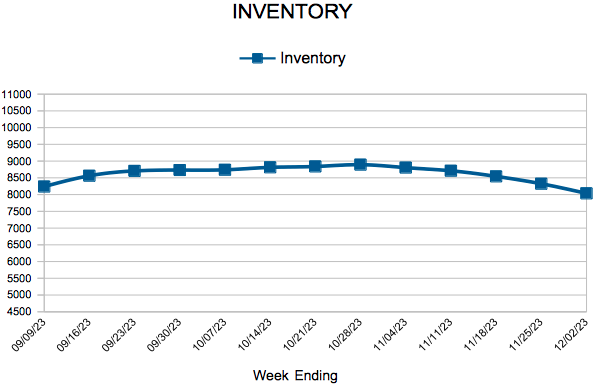
 For Week Ending December 9, 2023