New Listings and Pending Sales
651-770-5000
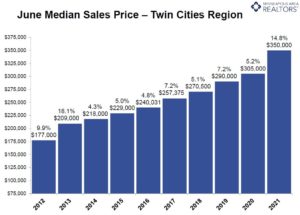
(July 16, 2021) – According to new data from the Minneapolis Area REALTORS® and the Saint Paul Area Association of REALTORS®, the median sales price for a home grew 14.8 percent to $350,000 in the Twin Cities metro area over the month of June. This milestone figure is the result of consistent year-over-year growth in median sales price. This year, all six months have experienced a 10.0 percent increase or greater in median sales price, amounting to a nominal increase of $49,000.
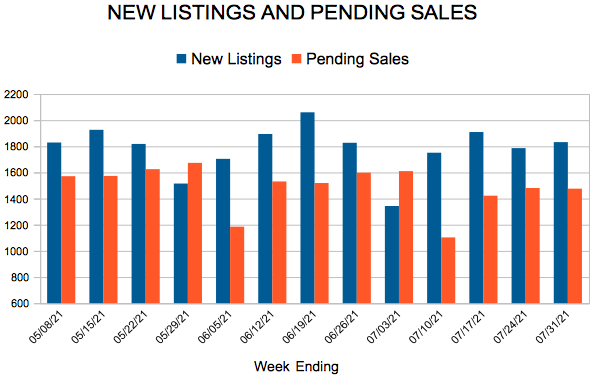
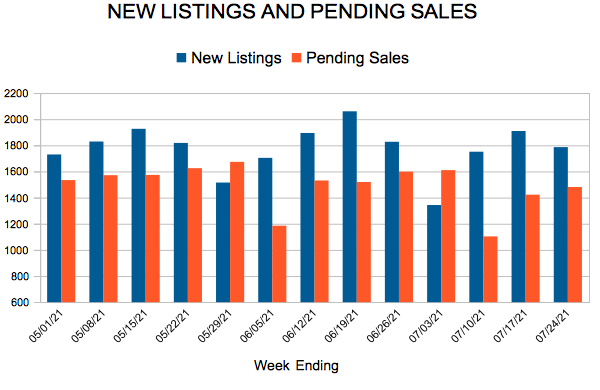
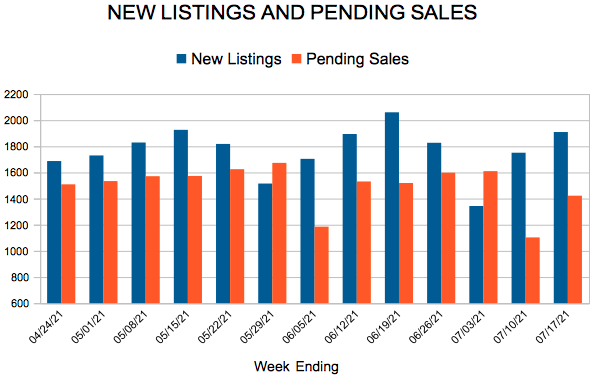
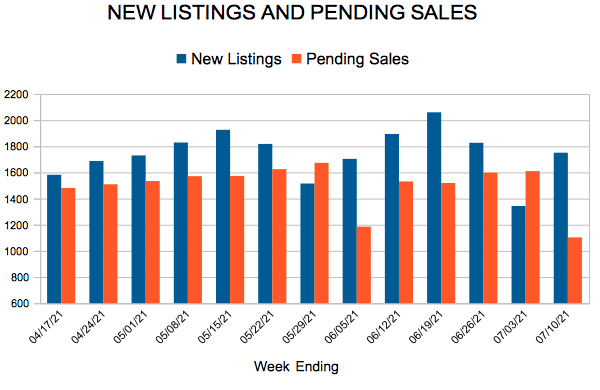
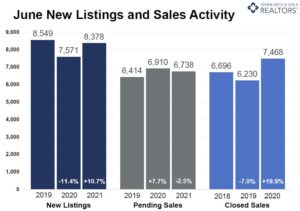
Buyer activity in June fell slightly, down 2.5 percent from 2020, after twelve straight months of strong upward momentum. Although this past month was inconsistent with the year-long positive trend, 2021 surpassed the benchmark set in 2019 by 10.9 percent when considering year-to-date performance. Additionally, median days on market for listings remained at a rapid seven days, indicating that demand for homes continues to stay strong.
“Declining buyer activity could be a result of the stiff competition buyers are facing and the end of quarantine restrictions that allow us to focus on family during the summer holidays,” according to Todd Walker, President of Minneapolis Area REALTORS®. “While increasing home prices are usually a good sign for our industry, frequent bids over asking price will naturally cause some buyers to wait out until the market softens and they have a better chance to secure their next home.”
Seller activity grew 10.7 percent last month, resulting in a year-to-date high of 8,378 homes. However, new listings in June were marginally below 2019 performance, down 2.0 percent. As buyer demand out-paced seller supply in the past two years, the Twin Cities continued to be a strong sellers’ market throughout June. The month’s supply of inventory for the metro area remained at 1.0 month, a figure that has not grown significantly all year.
“Although the supply of new listings for June was comparable with pre-COVID performance, there is not enough inventory to meet our current demand,” said Tracy Baglio, President of the Saint Paul Area Association of REALTORS®. “Our Realtors® and their clients are eager for a larger, more diverse, inventory in the housing market. A sustainable balance of buyers and sellers will lead to long-term success in our industry.”
Activity varies by area, price point and property type. Sales of single-family homes were up 47.7 percent in Minneapolis and up 43.3 percent in St. Paul, suggesting demand remains strong in the core cities. Condos continue to lead sales growth by property type. Across the 16-county Twin Cities region condo sales rose 70.5 percent. Sales of previously owned homes rose 23.6 percent while new construction rose 8.2 percent.
May 2021 by the numbers compared to a year ago• Sellers listed 8,378 properties on the market, a 10.7 percent increase from last June
• Buyers signed 6,738 purchase agreements, down 2.5 percent (7,468 closed sales, up 19.9 percent)
• Inventory levels fell 35.5 percent to 6,592 units
• Month’s Supply of Inventory was down 47.6 percent to 1.1 month (4-6 months is balanced)
• The Median Sales Price rose 14.8 percent to $350,000
• Days on Market decreased 52.4 percent to 20 days, on average (median of 7 days, down 61.1 percent)
• Changes in Sales activity varied by market segment

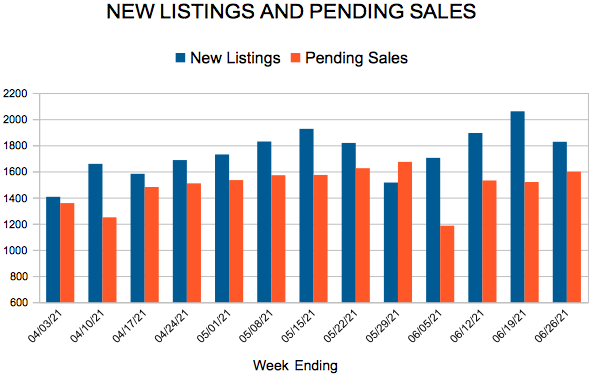
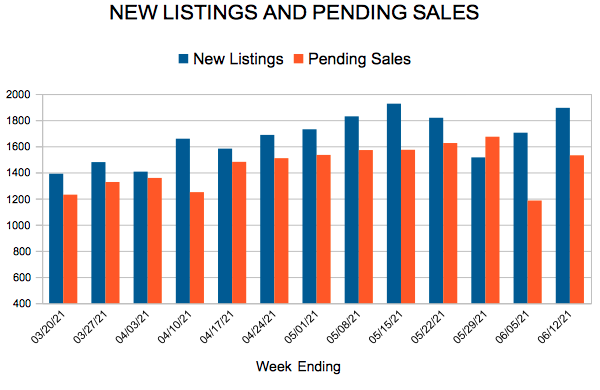
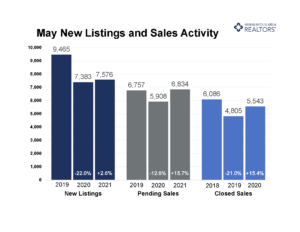
(June 16, 2021) – According to new data from the Minneapolis Area REALTORS® and the Saint Paul Area Association of REALTORS®, buyer activity in May was up 15.7 percent compared to last year, a twelfth-straight increase in month-over-month pending sales. Demand from buyers in the Twin Cities metro continues to out-pace the supply of new listings into the market.
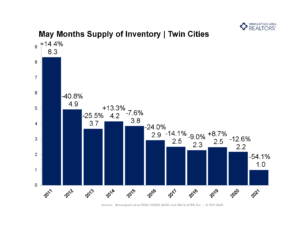
Seller activity in May grew slightly in a year, up 2.6 percent from 2020, but dropped by 19.9 percent compared to 2019, our most recent pre-COVID year. The relative imbalance in performance between buyers and sellers has led to a strong seller’s market. Currently, the Twin Cities has 1.0 month’s supply of inventory. Typically, four to six months is considered a balanced market.
“Half of all listings in the Twin Cities have an accepted offer within a week,” according to Tracy Baglio, President of the Saint Paul Area Association of REALTORS®. “As the summer season begins to build, buyers need to continue to be prepared to make firm decisions and strong offers on a home.”
In May, homes spent a median seven days on market, which is down 56.3 percent from last year. The quick shelf life of listings is particularly impressive given that the median price of a home in the Twin Cities metro rose to $342,500, a 16.1 percent increase from last May. The 30-Year Fixed Rate Mortgage Average in the United States did not exceed 3.0 percent, giving buyers the ability to stretch their dollar further.
“Recent showing activity shows that prospective home buyers shifted their interests to more expensive homes,” said Todd Walker, President of Minneapolis Area REALTORS®. “Two years ago, listings priced under $200,000 saw the largest share of showing activity. This year listings around $250,000 have seen the greatest share of activity.”
Activity varies by area, price point and property type. Sales of single-family homes were up 42.1 percent in Minneapolis and 16.7 percent in St. Paul, suggesting demand remains strong in the core cities. Condos continue to lead sales growth by property type. Across the 16-county Twin Cities region condo sales rose 98.3 percent. Sales of previously owned homes rose 18.3 percent while new construction rose 5.5 percent.
May 2021 by the numbers compared to a year ago
