New Listings and Pending Sales
651-770-5000
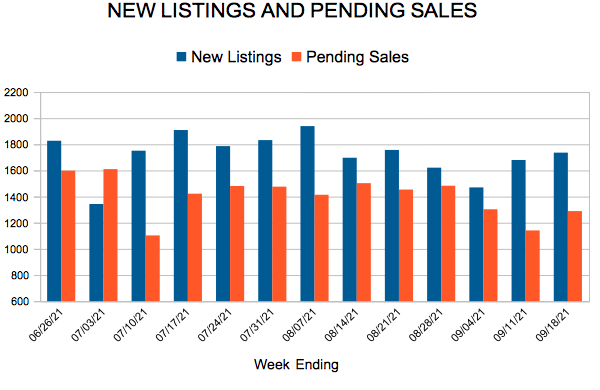
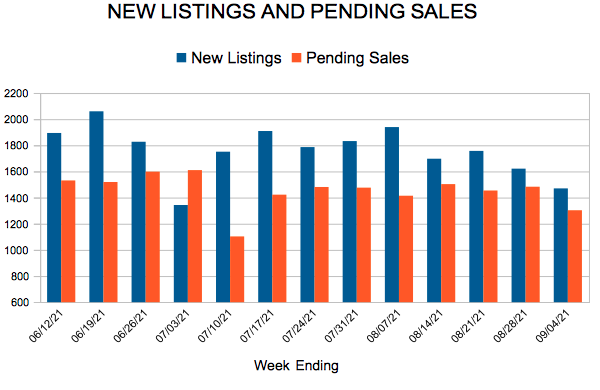
(September 17, 2021) – According to new data from Minneapolis Area REALTORS® and the Saint Paul Area Association of REALTORS®, listings throughout the Twin Cities sold quickly and often at or above list price. Though we remain undersupplied, there are signs of inventory stabilizing. The median sales price and price per square foot both increased.
Seller activity was down 3.6 percent while closed sales were up 0.6 percent. Pending sales—the number of signed purchase agreements—fell 10.3 percent from the frenzied pace of 2020 but remain above 2019 levels.
The 6,525 signed purchase agreements in August actually represent an 8.7 percent increase from August 2019. While we may struggle to reach the same level of demand from 2020, this upward trend in demand over two years confirms that buyer interest and activity remains strong. Median days on market fell 33.3 percent from last August to 10 days. This fast paced landscape where multiple offers remain common continues to push prices higher and allows some sellers to accept offers above their asking price.
“Even though these declines have moderated, incoming supply from new listings hasn’t changed much in recent years while, in fact, buyers have become more active,” said Todd Walker, President of Minneapolis Area REALTORS®. “Some of this arises from the fact that last year’s market was atypical and was shifted later into the year than a typical spring and summer market due to COVID.” The metro remains a seller’s market with just 1.4 months supply of inventory. Historically, six months of supply is considered a balanced market. That’s the lowest figure for any August going back to 2003.
The median sales prices remained at a record high of $350,000 for the third straight month. That’s an 11.1 percent increase compared to August 2020. Home prices have likely reached their seasonal peak for the year, but year-over-year increases compared to 2020 are likely to continue. Sellers are also receiving 102.4 percent of their list price, on average.
“Lately, home prices have increased more than the ability of some buyers to afford them,” according to Tracy Baglio, President of the Saint Paul Area Association of REALTORS®. “One silver lining is that average 30-year mortgage rates have remained historically low around 2.9 percent through most of the summer. Historically low-interest rates are helping ease the monthly payment of the higher home prices.”
Activity varies by area, price point and property type. Sales of condominiums were up 11.3 percent in Minneapolis and up 17.1 percent in St. Paul. Across the 16-county Twin Cities region new construction sales fell 24.1 percent while previously owned sales rose 3.7 percent. Single-family home sales in Eden Prairie rose 63.0 percent as did those in Cottage Grove by 23.3 percent. Single-family homes in Hudson and Otsego fell, 23.2 percent and 21.3 percent respectively.
August 2021 by the numbers compared to a year ago
• Sellers listed 7,644 properties on the market, a 3.6 percent decrease from last August
• Buyers signed 6,525 purchase agreements, down 10.3 percent (6,858 closed sales, up 0.6 percent)
• Inventory levels fell 20.1 percent to 7,686 units
• Month’s Supply of Inventory was down 26.3 percent to 1.3 months (4-6 months is balanced)
• The Median Sales Price rose 11.1 percent to $350,000
• Days on Market decreased 43.6 percent to 22 days, on average (median of 10 days, down 33.3 percent)
• Changes in Sales activity varied by market segment
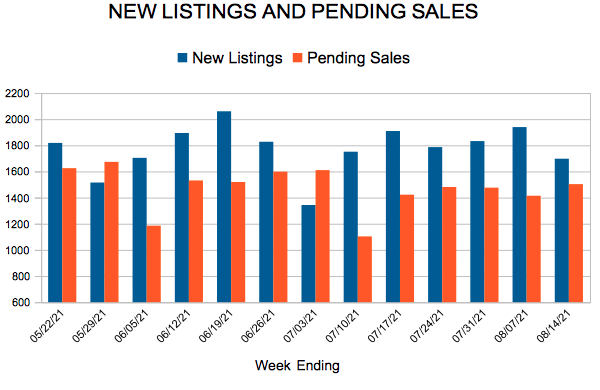
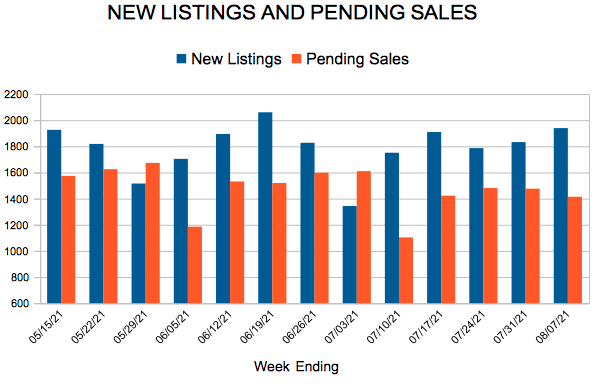
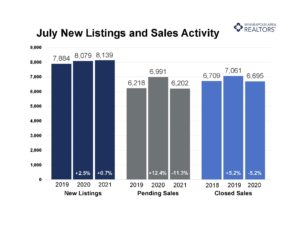
(August 17, 2021) – According to new data from the Minneapolis Area REALTORS® and the Saint Paul Area Association of REALTORS®, buyer activity in the month of July more closely resembled a typical, pre-pandemic summer than the frenzied buying spree seen over the last year or so. Demand as measured by pending sales was down 11.2 percent from July 2020 but was flat compared to July 2019.
Meanwhile, seller activity in the Twin Cities Metro increased for a fourth consecutive month. The number of homes listed on the market during the month was up 0.7 percent from last year, partly a result of the pullback in seller activity last spring and summer.
 “Buyer activity was remarkably strong around this time last year,” said Tracy Baglio, President of the Saint Paul Area Association of REALTORS®. “It’s important to put softening sales figures in context. We’re returning to a more typical market in line with the past five years. Compared to the frenzied pace of Summer 2020, that appears to be a slowdown, but it’s really just ‘normalization.’” Overall, sellers are still firmly in control of this market; that hasn’t changed. With just 1.3 months supply of inventory, the metro remains a sellers’ market. Historically, six months of supply is considered a balanced market.
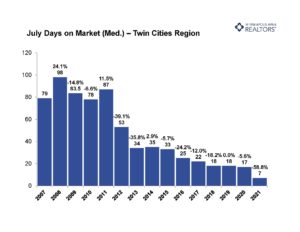
Another hallmark of supply-constrained markets is fast market times. The median number of days a property remained on market declined 58.8 percent to seven days. In other words, half of the pending sales in July had accepted offers within a week of being listed. On the other hand, home prices were up 11.9 percent from last July to arrive at $350,000 for the month. That’s even with June, even though prices tend to reach their seasonal peak in June.
 “With offers still coming in at an average of 3.6 percent over original asking price, more people are understanding the strength of this market,” according to Todd Walker, President of Minneapolis Area REALTORS®. “Any supply increase can readily be absorbed by the record demand in the marketplace, and any rebalancing or adjustment will take some time to play out.”
Activity varies by area, price point and property type. Sales of single-family homes were up 3.4 percent in Minneapolis and level in St. Paul, suggesting demand remained strong in the core cities. Condos were the only property type to grow in year over year sales. Across the 16-county Twin Cities region condo sales rose 8.6 percent. Sales of previously owned homes fell 2.5 percent while new construction dropped 23.9 percent.
July 2021 by the numbers compared to a year ago