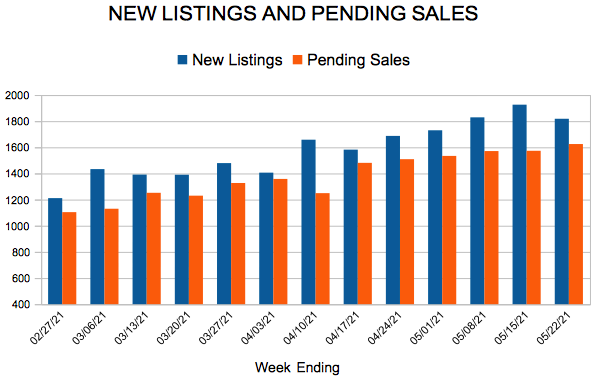
New Listings and Pending Sales
651-770-5000
 For Week Ending May 22, 2021
A new analysis from Realtor.com® found that 20% of home sales nationwide in the first two months of this year were purchased in cash, up about 5% from a year ago. The substantial increase in cash buyers can be partially attributed to the competitiveness of the housing market, where a cash offer can help a buyer’s offer stand out from competing offers. Meanwhile, for buyers that do need to finance their purchase, mortgage rates on a 30-year fixed-rate mortgage averaged just 3% last week.
In the Twin Cities region, for the week ending May 22:
For the month of April:
All comparisons are to 2020
Click here for the full Weekly Market Activity Report. From MAAR Market Data News.
May 27, 2021
Mortgage rates are down below three percent, continuing to offer many homeowners the potential to refinance and increase their monthly cash flow. In fact, homeowners who refinanced their 30-year fixed-rate mortgage in 2020 saved more than $2,800 dollars annually. Substantial opportunity continues to exist today, as nearly $2 trillion in conforming mortgages have the ability to refinance and reduce their interest rate by at least half a percentage point.
Information provided by Freddie Mac.
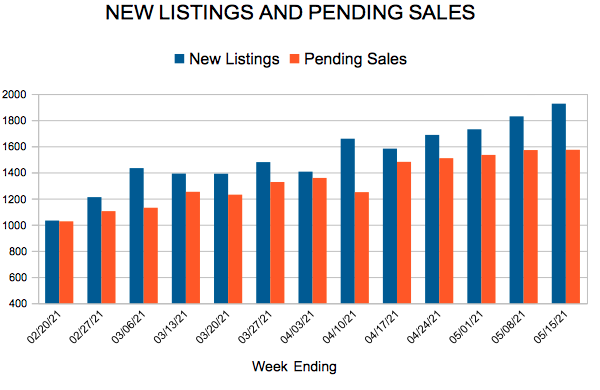

 For Week Ending May 15, 2021
Despite elevated demand for housing, construction of new homes fell in April, with the U.S. Department of Housing and Urban Development and the U.S. Census Bureau reporting a 9.5% decrease in housing starts from the previous month. Rising building costs continue to hinder affordability and inventory for many homebuyers, although shortages in labor, issues with the U.S. supply chain, and lasting impact from late winter storms have also contributed to the decline in new construction activity, putting some projects on pause for the time being.
In the Twin Cities region, for the week ending May 15:
For the month of April:
All comparisons are to 2020
Click here for the full Weekly Market Activity Report. From MAAR Market Data News.
April was another strong month for home sales. The busy spring market continues to see many multiple offer situations driving sales prices above asking price.
(May 17, 2021) – According to new data from the Minneapolis Area REALTORS® and the Saint Paul Area Association of REALTORS®, seller activity in April was up 21.7 percent compared to last year, when new listings dipped partly due to COVID-19. The number of homes that were put on the market in April is comparable to pre-pandemic levels in 2019 and 2018.
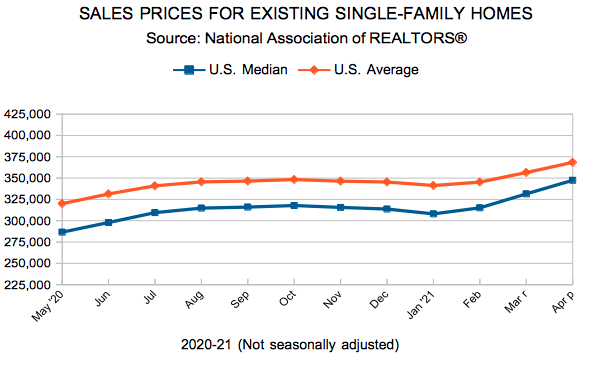
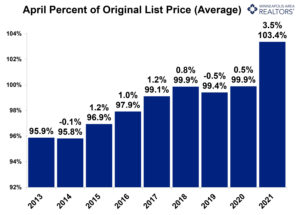
The median price of a home in the 16-county Twin Cities metro rose to $337,000, a 10.5 percent increase from last April and a new record high for the region. Even so, half of homes go under contract within 8 days of listing, the fastest time in at least 14 years. This is a clear indication that the metro is still in need of a greater housing supply to keep up with rising demand.
“It’s promising to see improvements in housing supply, but it’s clear that we aren’t out of the woods just yet,” said Todd Walker, President of Minneapolis Area REALTORS®. “In time, more potential sellers will be encouraged to list, enticed by rising prices and more inventory. In the meantime, developers need incentives to expand new inventory, particularly in affordable price ranges.”
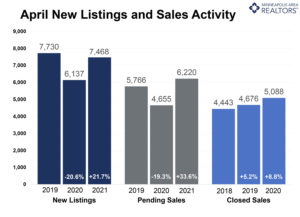
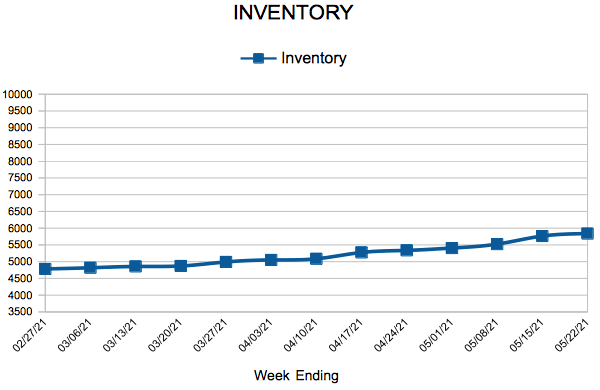
Although supply rebounded to that of pre-pandemic levels in April, the increase in demand was even greater. Pending sales are up 34.0 percent from April of last year and exceed 2019 numbers by 8.2 percent. With 5,619 homes for sale, the Twin Cities currently has 1.0 month’s supply of inventory. Typically, 4-6 months is considered a balanced market.
“Buyers still benefit from record low mortgage rates at around 3.0 percent,” according to Tracy Baglio, President of the Saint Paul Area Association of REALTORS®. “Although a limited supply is driving prices higher, low rates are a strong incentive to offer a competitive bid for a home.”
Activity varies by area, price point and property type. Sales of single-family homes were up 32.0 percent in Minneapolis and 14.8 percent in St. Paul, suggesting demand remains strong in the core cities. Across the 16-county Twin Cities region condo sales rose 50.6 percent, outpacing single-family and townhomes. Sales on previously owned homes rose 10.3 percent while new construction rose 2.0 percent. Luxury property sales ($1M+) are up 180.6 percent from last April, 90.6 percent from April 2019.
April 2021 by the numbers compared to a year ago