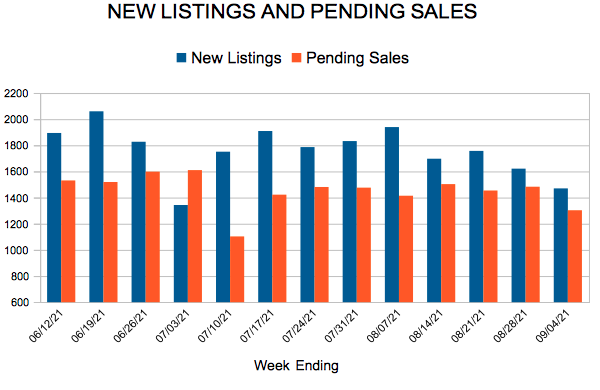
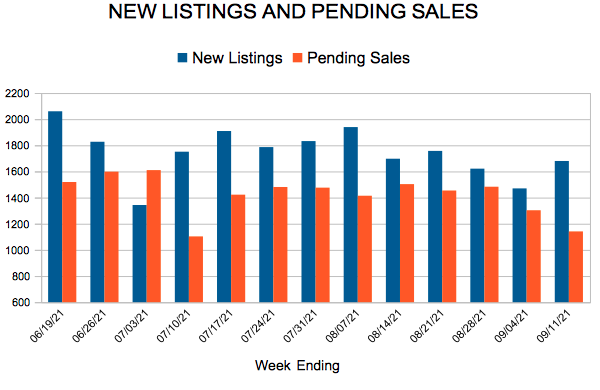
New Listings and Pending Sales
651-770-5000
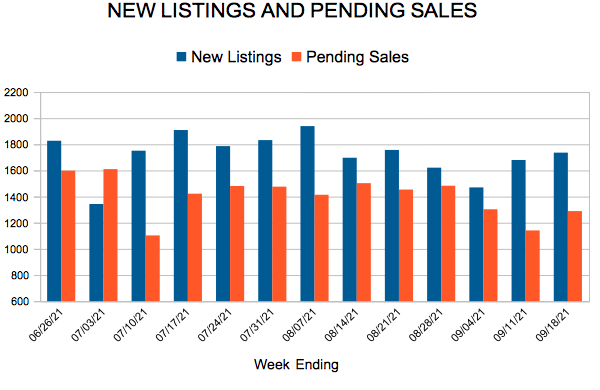
 For Week Ending September 18, 2021
Despite increases in new listings in recent months, America is facing an epic housing shortage, with realtor.com reporting the U.S. needs an additional 5.24 million homes to meet current population needs, an increase of 1.4 million homes since 2019, as new-home construction has failed to keep up with household formations. Assuming the rate of household formations continues, the average rate of new home completions would need to triple over the next 5 – 6 years in order to meet current demand.
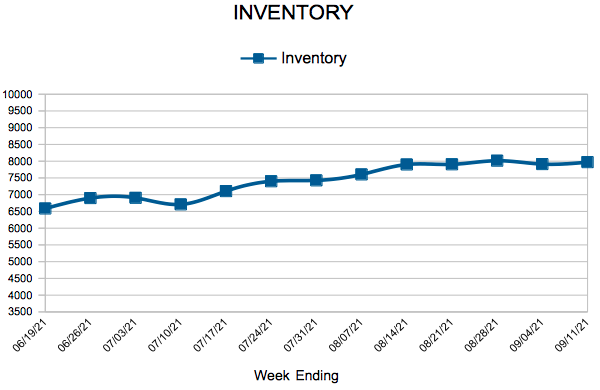
In the Twin Cities region, for the week ending September 18:
For the month of August:
All comparisons are to 2020
Click here for the full Weekly Market Activity Report. From MAAR Market Data News.
In new construction, home builders continue to struggle to meet buyer demand, as housing starts nationwide dropped 7% last month, according to the Commerce Department.
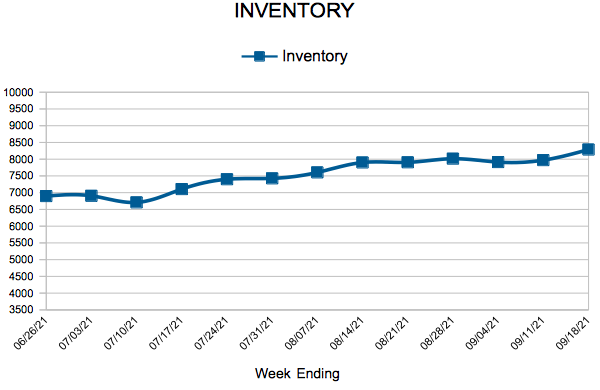
(September 17, 2021) – According to new data from Minneapolis Area REALTORS® and the Saint Paul Area Association of REALTORS®, listings throughout the Twin Cities sold quickly and often at or above list price. Though we remain undersupplied, there are signs of inventory stabilizing. The median sales price and price per square foot both increased.
Seller activity was down 3.6 percent while closed sales were up 0.6 percent. Pending sales—the number of signed purchase agreements—fell 10.3 percent from the frenzied pace of 2020 but remain above 2019 levels.
The 6,525 signed purchase agreements in August actually represent an 8.7 percent increase from August 2019. While we may struggle to reach the same level of demand from 2020, this upward trend in demand over two years confirms that buyer interest and activity remains strong. Median days on market fell 33.3 percent from last August to 10 days. This fast paced landscape where multiple offers remain common continues to push prices higher and allows some sellers to accept offers above their asking price.
“Even though these declines have moderated, incoming supply from new listings hasn’t changed much in recent years while, in fact, buyers have become more active,” said Todd Walker, President of Minneapolis Area REALTORS®. “Some of this arises from the fact that last year’s market was atypical and was shifted later into the year than a typical spring and summer market due to COVID.” The metro remains a seller’s market with just 1.4 months supply of inventory. Historically, six months of supply is considered a balanced market. That’s the lowest figure for any August going back to 2003.
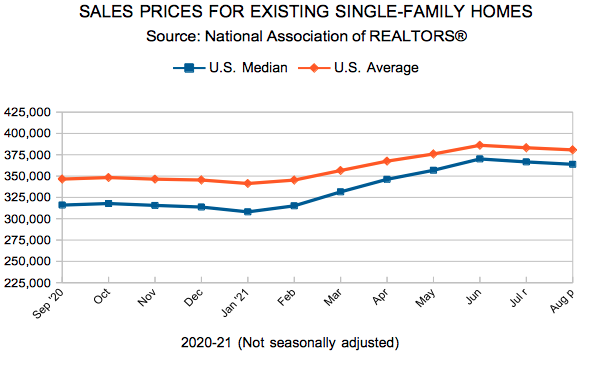
The median sales prices remained at a record high of $350,000 for the third straight month. That’s an 11.1 percent increase compared to August 2020. Home prices have likely reached their seasonal peak for the year, but year-over-year increases compared to 2020 are likely to continue. Sellers are also receiving 102.4 percent of their list price, on average.
“Lately, home prices have increased more than the ability of some buyers to afford them,” according to Tracy Baglio, President of the Saint Paul Area Association of REALTORS®. “One silver lining is that average 30-year mortgage rates have remained historically low around 2.9 percent through most of the summer. Historically low-interest rates are helping ease the monthly payment of the higher home prices.”
Activity varies by area, price point and property type. Sales of condominiums were up 11.3 percent in Minneapolis and up 17.1 percent in St. Paul. Across the 16-county Twin Cities region new construction sales fell 24.1 percent while previously owned sales rose 3.7 percent. Single-family home sales in Eden Prairie rose 63.0 percent as did those in Cottage Grove by 23.3 percent. Single-family homes in Hudson and Otsego fell, 23.2 percent and 21.3 percent respectively.
August 2021 by the numbers compared to a year ago
• Sellers listed 7,644 properties on the market, a 3.6 percent decrease from last August
• Buyers signed 6,525 purchase agreements, down 10.3 percent (6,858 closed sales, up 0.6 percent)
• Inventory levels fell 20.1 percent to 7,686 units
• Month’s Supply of Inventory was down 26.3 percent to 1.3 months (4-6 months is balanced)
• The Median Sales Price rose 11.1 percent to $350,000
• Days on Market decreased 43.6 percent to 22 days, on average (median of 10 days, down 33.3 percent)
• Changes in Sales activity varied by market segment
For Week Ending September 11, 2021
Fall brings good news for those looking to purchase a home, with realtor.com reporting the best time to buy a home is now, according to their Best Time to Buy Report, which analyzed listing data back to 2018. Based on the data, analysts found that the period between Sept. 12 and Oct. 17 will offer the most favorable home buying conditions to prospective buyers, as the majority of U.S. markets are predicted to see more homes for sale, less competition, and increased days on market than at any other time this year.
In the Twin Cities region, for the week ending September 11:
For the month of July:
All comparisons are to 2020
Click here for the full Weekly Market Activity Report. From MAAR Market Data News.