For Week Ending December 25, 2021
Home prices soared to new heights in 2021 and homebuyers are having to borrow more to afford their home purchase as a result, with the average home loan reaching $414,115 as of last measure, according to The Mortgage Bankers Association. As prices and loan amounts increase, borrowers have to come up with additional funds for down payments, forcing some to dip into their savings, take on second jobs, or borrow money from friends or family to remain competitive and afford the increasing costs of homeownership in the current market.
IN THE TWIN CITIES REGION, FOR THE WEEK ENDING DECEMBER 25:
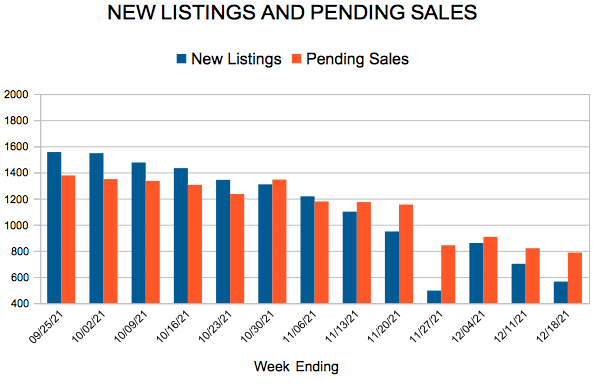
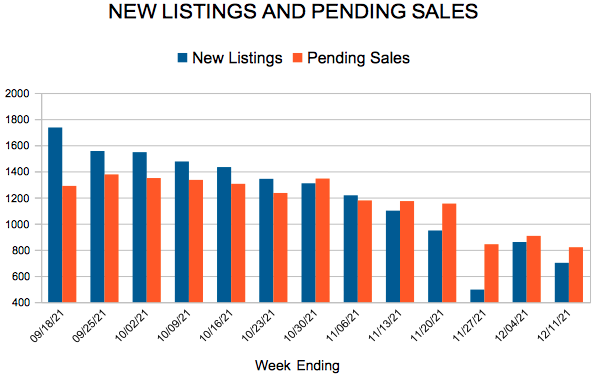
- New Listings decreased 25.1% to 284
- Pending Sales decreased 11.1% to 561
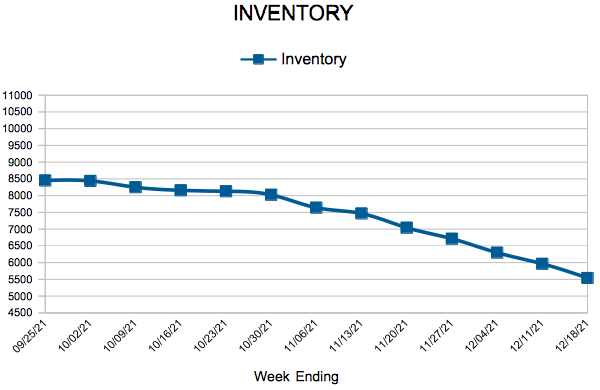
- Inventory decreased 22.0% to 5,156
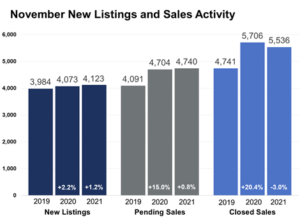
FOR THE MONTH OF NOVEMBER:
- Median Sales Price increased 9.5% to $339,543
- Days on Market decreased 11.8% to 30
- Percent of Original List Price Received decreased 0.4% to 99.8%
- Months Supply of Homes For Sale decreased 21.4% to 1.1
All comparisons are to 2020
Click here for the full Weekly Market Activity Report. From MAAR Market Data News.