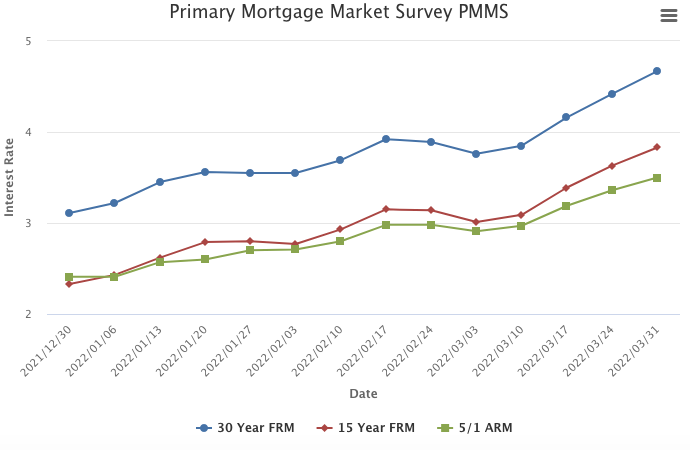
March 31, 2022
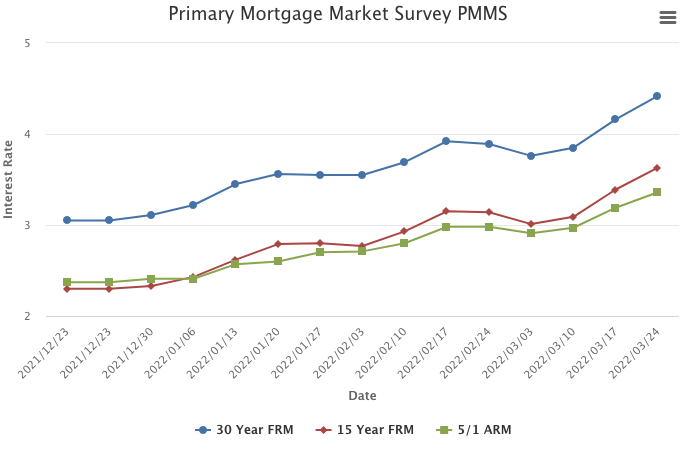
Mortgage rates continued moving upward in the face of rapidly rising inflation as well as the prospect of strong demand for goods and ongoing supply disruptions. Purchase demand has weakened modestly but has continued to outpace expectations. This is largely due to unmet demand from first-time homebuyers as well as a select few who had been waiting for rates to hit a cyclical low.
Information provided by Freddie Mac.
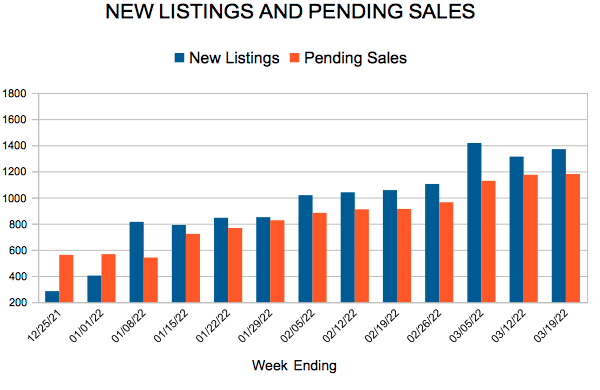
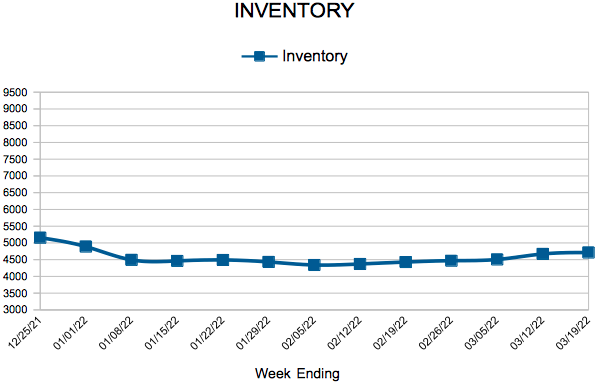
 For Week Ending March 19, 2022