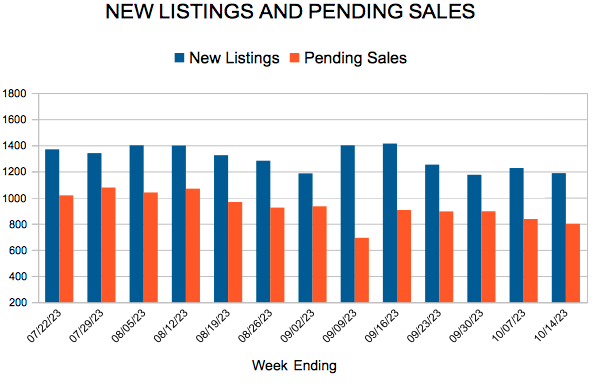
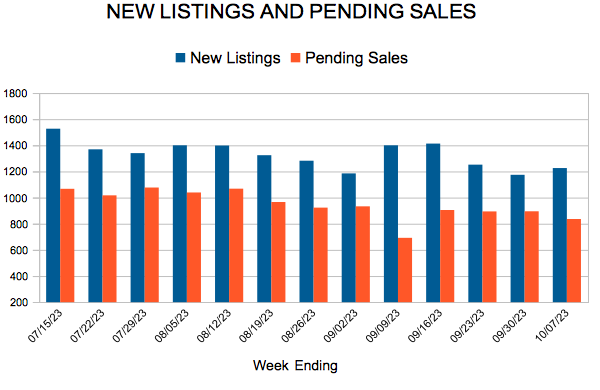
New Listings and Pending Sales
651-770-5000
 For Week Ending October 14, 2023
According to ATTOM’s Q3 2023 U.S. Home Affordability Report, median priced single-family homes and condos were less affordable compared to historical averages in 99% of counties nationwide in the 3rd quarter of 2023. Home sale prices have continued to rise across the country, and with mortgage rates above 7%, major homeownership expenses now take up 35% of the average national wage, the highest level since 2007, and well above the 28% affordability standard commonly used by many lenders.
IN THE TWIN CITIES REGION, FOR THE WEEK ENDING OCTOBER 14:
FOR THE MONTH OF SEPTEMBER:
All comparisons are to 2022
Click here for the full Weekly Market Activity Report. From MAAR Market Data News.
October 19, 2023
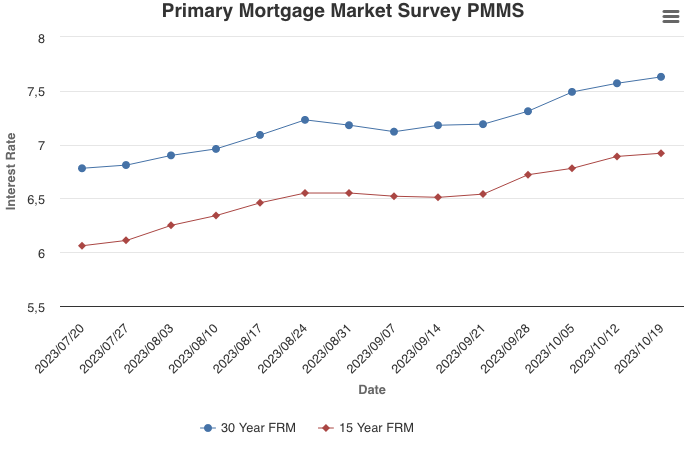
Mortgage rates continued to approach eight percent this week, further impacting affordability. In this environment, it’s important that borrowers shop around with multiple lenders for the best mortgage rate. With research showing down payment is the single largest barrier to first-time homebuyers attaining homeownership, borrowers should also ask their lender about down payment assistance. Launched this week, Freddie Mac’s DPA One® tool helps lenders and homebuyers identify and take advantage of down payment assistance programs nationwide.
Not only are homebuyers feeling the impact of rising rates, but home builders are as well. Incoming data shows that the construction of new homes rebounded in September but as rates keep rising, home builders appear to be losing confidence. As a result, construction could trend down in the short-term.
Information provided by Freddie Mac.
 For Week Ending October 7, 2023
Adjustable-rate mortgages (ARM) continue to grow in popularity as prospective homebuyers aim to combat rising housing costs. Applications for 5/1 adjustable-rate mortgages rose 32.5% the week ending October 6 from four weeks earlier, according to the Mortgage Bankers Association. Effective rates for a 5/1 ARM averaged about 6.66% compared to 7.49% for a traditional 30-year fixed-rate mortgage, with the share of ARM applicants representing 9.2% of all borrowers, the highest percentage since November 2022.
IN THE TWIN CITIES REGION, FOR THE WEEK ENDING OCTOBER 7:
FOR THE MONTH OF SEPTEMBER:
All comparisons are to 2022
Click here for the full Weekly Market Activity Report. From MAAR Market Data News.
(October 16, 2023) – According to new data from Minneapolis Area REALTORS® and the Saint Paul Area Association of REALTORS®, home prices rose slightly in September. Both buyer and seller activity were lower compared to last year but there were important differences across areas and market segments.
Sellers, Buyers and Housing Supply
Many homeowners are feeling incentivized to stay put—particularly those with sub-4.0% rates who would face much higher payments given the increase in prices and stubbornly high mortgage rates. As a result, new listings were down another 6.4% after a 17.2% decline last September. Buyers face a similar set of considerations, but first-timers don’t have the benefit of equity from previous home ownership, and many struggle to amass a downpayment given the rising cost of living. Closings were down 17.1% but pending sales were down a more modest 7.3%—perhaps offering a glimpse of what’s to come. Millennials now in their prime homeownership years and Boomers looking to downsize are finding limited options. More buyers are choosing to deploy cash instead of paying near 8.0% interest, but that’s difficult for many.
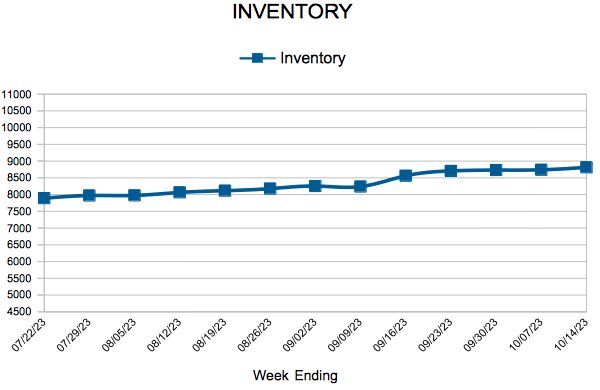
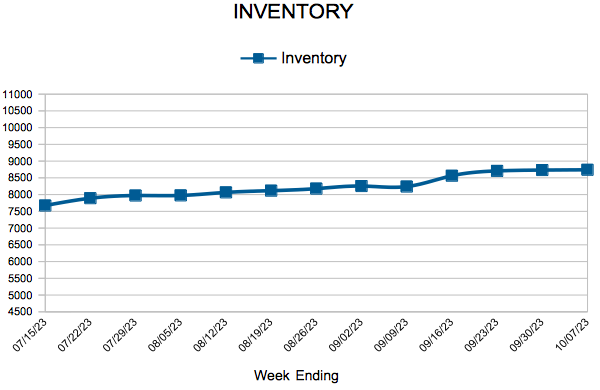
The reason the market still feels so “tight” and why prices continue to rise is because both buyer and seller activity have downshifted in tandem. In the past, we’ve seen housing supply levels rise as demand falls, and that usually results in softening prices. But that’s not the case here. Both supply and demand levels are down, so the relative balance hasn’t changed as much as some anticipated. In addition, sellers don’t appear eager to list their homes any time soon. “Many homeowners not experiencing a major life or job change aren’t quite as motivated to make a move,” said Jerry Moscowitz, President of Minneapolis Area REALTORS®. “Many qualified buyers are finding success purchasing a home now and plan to refinance when the interest rates are lower.”
Prices, Market Times and Negotiations
The downshift on both sides of the closing table has also kept market times relatively brisk and negotiations are still leaning in the seller’s favor. Half the homes went under contract in under 17 days compared to 19 days last September. Last month sellers accepted 99.3% of their original list price compared to 98.9% last year. Those two indicators reflect the surprisingly strong position in which many sellers still find themselves.
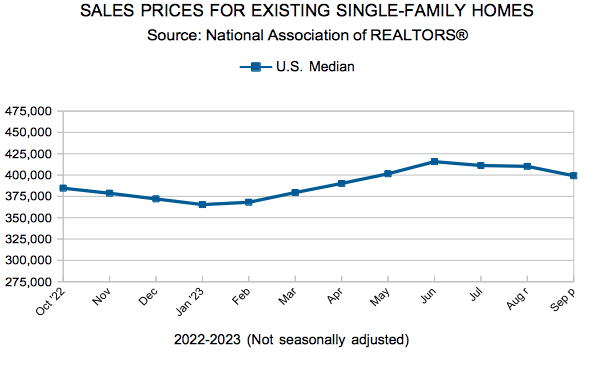
Despite softer demand, sluggish seller activity has also kept prices elevated. There has been just one month of year-over-year price declines since February 2012. That was in May of this year. There have been some flat months this year as well as modest gains, but it appears prices could be up slightly for the year. For September, the median home price rose 2.2% to $370,305. “Sellers who locked in low interest rates are reluctant to give them up,” said Brianne Lawrence, President of the Saint Paul Area Association of REALTORS®. “That’s kept inventory low and prices strong, but it still feels quite different from the last few years.” We have 8,700 active listings. That needs to be closer to 20,000 to have a balanced market.
Affordability, Rates and Payments
Even as the Federal Reserve paused and left their target rate unchanged at the September meeting, the 30-year fixed mortgage rate reached its highest level since 2000. The Housing Affordability Index, as expected, hit its lowest level since at least 2004. Given rates, incomes and prices at the time, affordability was better in 2006 than it is today. Using some assumptions around taxes and insurance, the monthly payment on the median priced home stands at $2,650 so far this year compared to $1,600 in 2020.
Location & Property Type
Market activity varies by area, price point and property type. New home sales rose while existing home sales fell. Single family sales were down more than townhome sales. Closings were down around 17.0% in both Minneapolis and St. Paul. Cities such as St. Anthony, Orono, Richfield and Golden Valley saw among the largest sales gains while New Hope, Robbinsdale, Eagan and Andover all had notably lower demand than last year.
September 2023 Housing Takeaways (compared to a year ago)
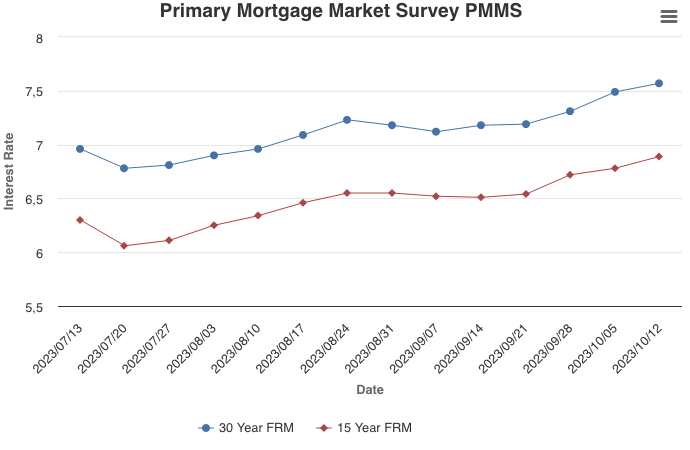
October 12, 2023
For the fifth consecutive week, mortgage rates rose as ongoing market and geopolitical uncertainty continues to increase. The good news is that the economy and incomes continue to grow at a solid pace, but the housing market remains fraught with significant affordability constraints. As a result, purchase demand remains at a three-decade low.
Information provided by Freddie Mac.