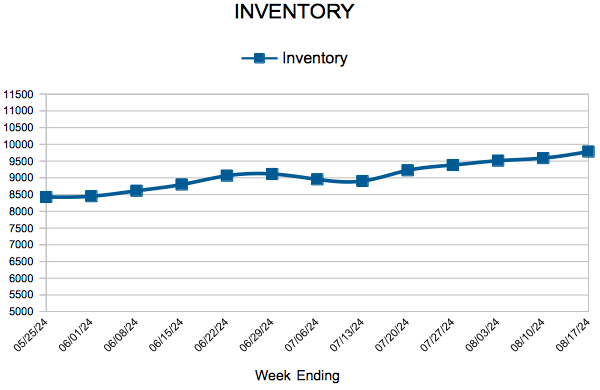
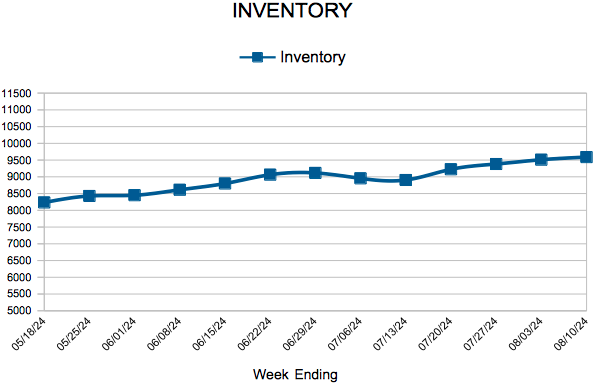
Inventory
651-770-5000
 For Week Ending August 17, 2024
The number of homes for sale continues to improve nationwide, marking the ninth straight month of growth. According to Realtor.com’s July 2024 Monthly Housing Market Trends Report, there were 36.6% more homes on the market in July compared to the same period last year. Prospective buyers, especially first-time homebuyers, will be pleased to know the growth in homes priced between $200,000 – $350,000 jumped 47.3% year-over-year, outpacing all other price categories.
IN THE TWIN CITIES REGION, FOR THE WEEK ENDING AUGUST 17:
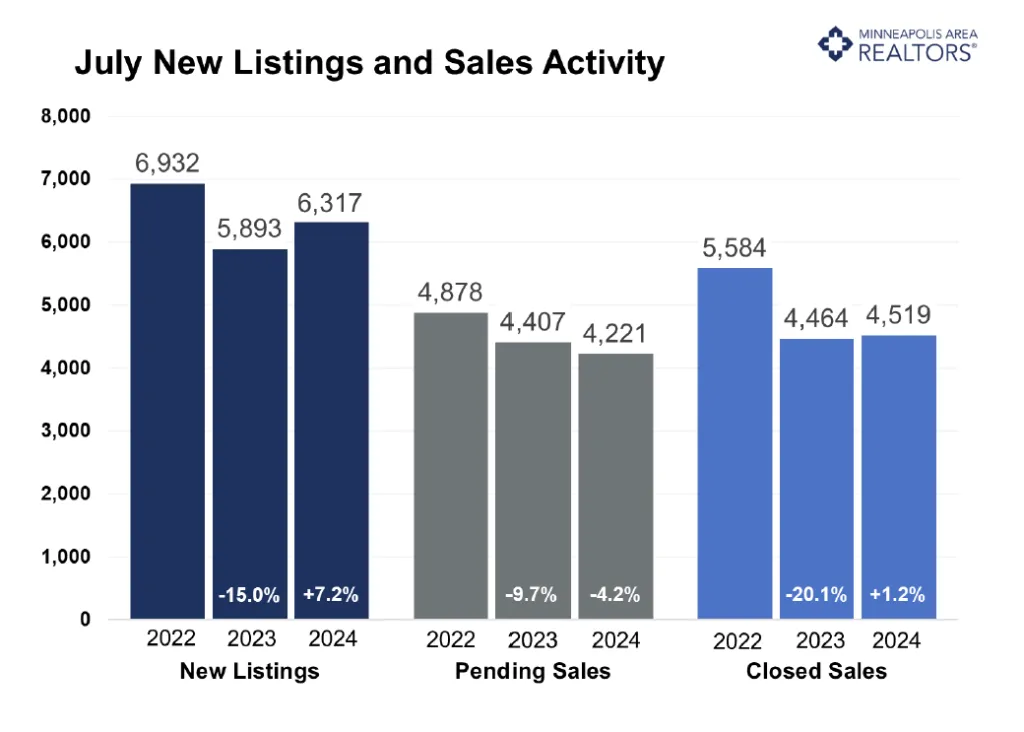
FOR THE MONTH OF JULY:
All comparisons are to 2023
Click here for the full Weekly Market Activity Report. From MAAR Market Data News.
August 22, 2024
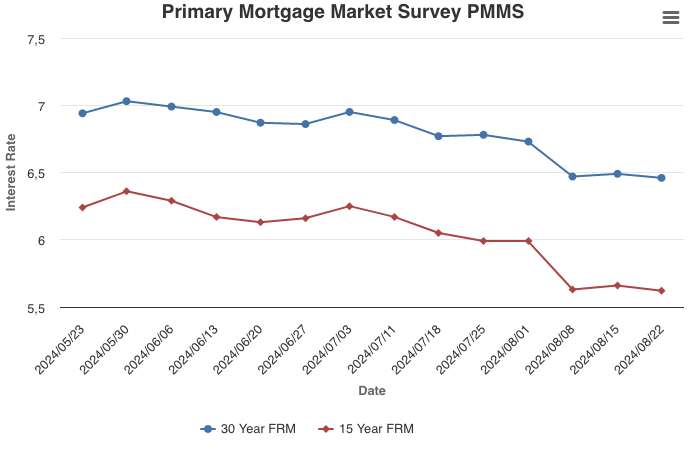
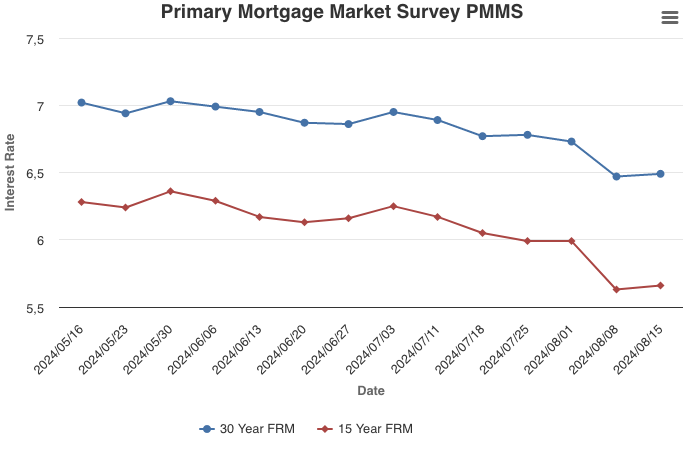
Although mortgage rates have stayed relatively flat over the past couple of weeks, softer incoming economic data suggest rates will gently slope downward through the end of the year. Earlier this month, rates plunged and are now lingering just under 6.5 percent, which has not been enough to motivate potential homebuyers. Rates likely will need to decline another percentage point to generate buyer demand.
Information provided by Freddie Mac.
 For Week Ending August 10, 2024
Homebuyer preferences for smaller homes continue to influence builder behavior. According to the U.S. Census Bureau, the typical new single-family home under construction had a median floor area of 2,139 square feet in the first quarter of 2024. That’s down from the same period last year, when the typical new home had a median floor area of 2,256 square feet, and the lowest reading since 2009, according to the National Association of Home Builders.
IN THE TWIN CITIES REGION, FOR THE WEEK ENDING AUGUST 10:
FOR THE MONTH OF JULY:
All comparisons are to 2023
Click here for the full Weekly Market Activity Report. From MAAR Market Data News.
(August 15, 2024) – According to new data from Minneapolis Area REALTORS® and the Saint Paul Area Association of REALTORS®, seller activity rose in July compared to last year while buyers pulled back. Inventory and prices were higher.
Sellers, Buyers and Housing Supply
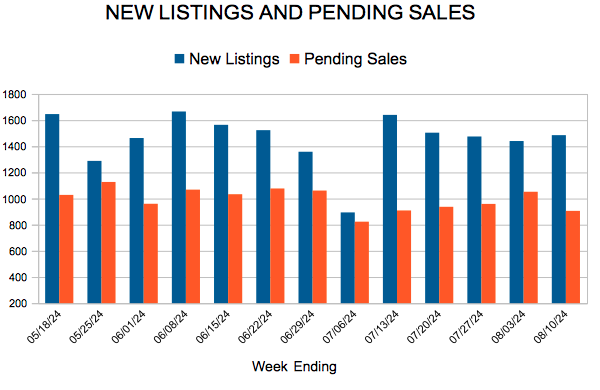
While the first quarter of 2024 was off to a good start, the second quarter was weaker. Homes were selling faster in January, February and March than last year. But homes were selling slower than a year ago in May, June and July. Sellers got stronger offers in January, February and March compared to last year. But then sellers accepted a smaller share of their list price in April, May, June and July. So, it’s important to put the current month’s activity for July in context. January and February of this year, for example, were abnormally warm, which allowed for more showings and sales. April, May and June all had higher than expected mortgage rates, which held back sales activity. Because of those variable factors and how they cloud apples-to-apples comparisons, it’s useful to assess market health based on a variety of time frames. To demonstrate, pending sales were down 4.2% for July but are up about 1.0% for the year. Market times were up 24.1% in July but are only up 4.8% so far this year.
Overall, seller activity has been rising modestly while buyer activity is relatively flat to up slightly for the year so far. That has also meant more inventory—also known as active listings or the number of homes for sale. But the inventory isn’t necessarily in the price buckets today’s home buyers want and need, and they may not be in the preferred market segment or location. Plus, it’s still squarely a seller’s market although not for all areas, segments or price points. Higher interest rates have stuck around, though there’s good evidence that will change. Most buyers (especially first-time) would agree that change can’t come soon enough as they’re still feeling the triple punch of rising prices, low inventory and higher mortgage rates. Plus, they lack the equity to use as a downpayment on the next home. There is a good amount of pent-up demand waiting for the affordability picture to improve. One concern is that as rates ease, demand will be unleashed, and buyers could find themselves in multiple-offer situations writing contracts for well over list price. That higher principle can negate any savings on monthly payments from lower mortgage rates. “It may very well be worth it to stomach a temporarily higher rate for a less competitive environment,” said Jamar Hardy, President of Minneapolis Area REALTORS®. “Buyers are eager for more supply, but we’re still finding consumers to be cautious and selective.”
Prices, Market Times and Negotiations
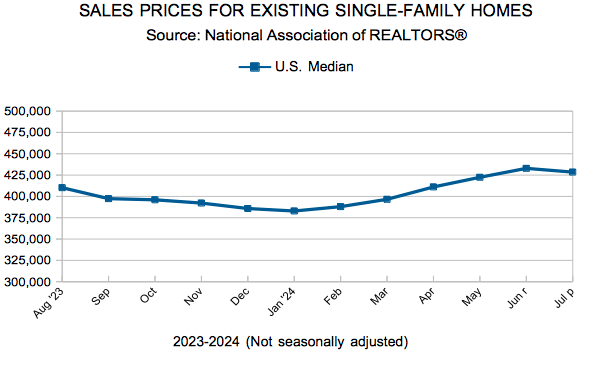
Each area and market segment are unique. The market-wide median sales price rose to $385,000, but new single-family homes tended to fetch $540,000 while existing condos were nearer to $215,000. Overall, sellers accepted offers at 99.5% of their list price on average. That said, listings priced between $300,000-$500,000 got offers at 100.1% of list price while homes over $1M were 97.9%. Once again, all listings tended to sell in about 36 days, but new homes took closer to 76 days to sell while existing homes got offers within 31 days. Single family homes are selling after 32 days, but condos are taking 63 days. “A slight slowdown in the second quarter activity is likely to change for the better as interest rates continue to ease,” said Amy Peterson, President of the Saint Paul Area Association of REALTORS®. “But those lower rates will mean more buyers in the pipeline who’ve felt priced out of the market previously will be home shopping again. Lots of people have that same idea so offer strategies could change with a more competitive market.”
Location & Property Type
As noted, housing markets are not homogeneous. New home sales outperformed existing home sales while condo sales fell much more than single family. Sales over $500,000 performed better than sales under $500,000, as higher-end buyers are less rate-sensitive. Cities such as Columbus, Hudson, Corcoran and Hanover saw among the largest sales gains while Mounds View, Orono, Medina and Victoria all had notably weaker demand. For cities with at least five sales, the highest priced areas were Wayzata, Independence, Orono and North Oaks while the most affordable areas were Lauderdale, North St. Paul, St. Paul Park and Oakdale.
From The Skinny Blog.
August 15, 2024
While rates increased slightly this week, they remain more than half a percent lower than the same time last year. In 2023, the 30-year fixed-rate mortgage nearly hit 8 percent, slamming the brakes on the housing market. Now, the 30-year fixed-rate hovers around 6.5 percent and will likely trend down in the coming months as inflation continues to slow. Lower rates are good news for potential buyers and sellers alike.
Information provided by Freddie Mac.